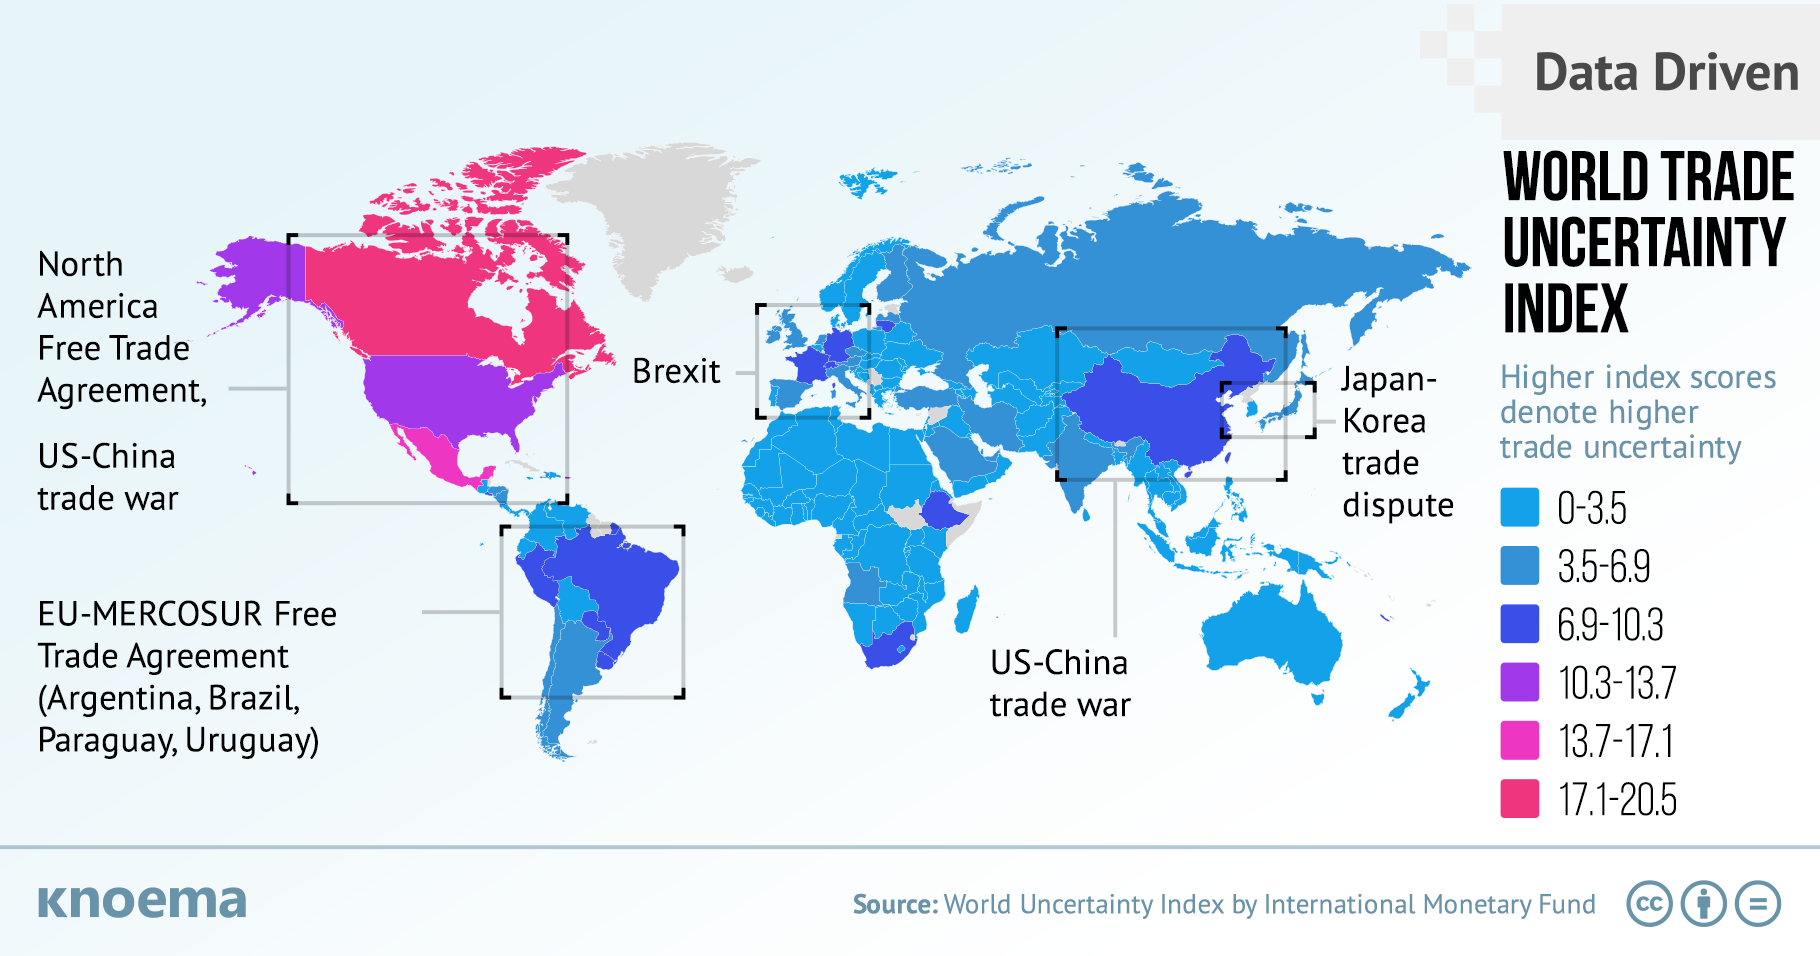
Recent analysis from the IMF cites increasing uncertainty caused by trade tensions as a primary driver of sluggish global growth, a trend which moved the IMF to issue a downward revision to its global GDP growth forecast in the July edition of the World Economic Outlook. According to IMF estimates, the escalation of trade uncertainty observed this year could consume around 0.75 percentage points of global growth in 2019.

To track trade tensions globally, the IMF and Stanford University teamed up to develop the World Trade Uncertainty Index (WTU).* This index measures trade uncertainty in 143 countries based on the frequency with which the word "uncertainty" is mentioned in country reports produced by the Economist Intelligence Unit. And today the index sends a clear message as it continues to hit new 20-year records: uncertainty has taken hold.

  • The surge in trade uncertainty since late 2018 coincides with the first tit-for-tat tariff increases between the US and China during 3Q2018. In the first quarter of 2019, the index rose sharply again after a significant increase in US tariffs on imports from China.

Trade uncertainty merits monitoring globally. The US-China bilateral dynamic, while certainly influencing recent Index scores, is not solely driving the overall index or the risk to global economic growth referenced by the IMF. 

  • Trade tensions are registering in European countries on the periphery of Brexit, the Japan-South Korea trade dispute (or "economic war"), and key US trading partners Canada and Mexico.
  • Advanced economies in general show the highest Index levels, followed by emerging markets.


*The WTU index methodology is similar to the well-known Global Economic Policy Uncertainty Index (EPU), however, the EPU uses a broad set of newspapers to monitor the use of the term uncertainty.

Связанные Insights от Knoema

China Trade Data | Latest Official Statistics

(October 2019) China and the United States reached a partial trade deal on Friday, October 11, with the US agreeing to forgo further tariff escalation in exchange for China agreeing to resume purchases of US farm products. However, even if trade terms improve between the countries, recent preliminary figures released by China's customs office suggest Chinese exports hurt by the trade war will need time to recover to 2018 levels. Since the beginning of 2019, China exported $348 billion to the United States, 11.3 percent less than during the same period of 2018.China's exports...

US Agricultural Exports to China Falling, Farmers Seek New Markets

Ask any American soybean farmer about current market conditions and US-China trade frictions will bubble up in the conversation. After the late June meeting between presidents Xi Jinping and Donald Trump in Osaka, Trump assured American farmers that trade talks would resume and that China would buy a tremendous amount of food and agricultural products very soon. Yet, in the month since, no significant purchases have been announced and no information is publicly available on large purchases in the offing, especially now, as the trade-war escalated again with the new 10-percent...

US-China Trade War: First Signs of Thaw

Weeks after US President Donald Trump and Chinese President Xi Jinping agreed to a temporary halt in the US-China trade war, the first positive signs of a return to normal trade relations are emerging. Last week, the China Grain Reserves Corporation (Sinograin) and fellow state-run Chinese enterprise Cofco bought more than 1.5 million tons of US soybeans, the first significant deal since the countries agreed to a 90-day truce from December 1, 2018, to March 1, 2019. The announcement caused a spike in soybean futures to $918.5 a bushel, the highest price since June. Soybeans were...

Export Concentration Index: A Measure of Economic Vulnerability

The concentration index of exports estimates a country’s reliance on a limited group of commodities as its primary source of foreign exchange income. Ranging from 0 (perfect diversification) to 1 (concentrated on a single product)*, a comparison of index scores to the contribution of natural resources to GDP worldwide shows that countries that are resource-rich tend to have less diversified export bases. Last year Iraq’s export concentration index reached 0.97, driven by its export concentration in mineral fuels, namely oil. Other oil exporters—including Angola, Iran, Kuwait, and...