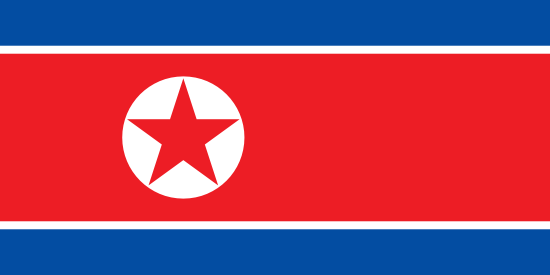
КНДР

  • Supreme Leader:Kim Jong-un
  • Премьер-министр:Kim Tok-hun
  • Столица:Pyongyang
  • Языки:Korean
  • Правительство
  • Статистическое агентство:No data
  • Население, человек:26 204 927 (2024)
  • Площадь, кв км:120 410
  • ВВП на душу населения, долл. США:No data
  • ВВП, млрд. долл. США:No data
  • Индекс Джини:No data
  • Рейтинг Ease of Doing Business:No data

Все наборы данных: 3 A B C E F G H I N O P Q S T U W
  • 3
    • Октябрь 2016
      Источник: Philipps-University of Marburg, Empirical Institutional Economics
      Загружен: Knoema
      Дата обращения к источнику: 07 декабря, 2016
      Выбрать
      The 3P Anti-trafficking Policy Index evaluates governmental anti-trafficking efforts in the three main policy dimensions (3Ps), based on the requirements prescribed by the United Nations Protocol to Prevent, Suppress and Punish Trafficking in Persons, especially Women and Children (2000).   The three main policy dimensions (3Ps) are:Prosecution of perpetrators of human traffickingPrevention of human traffickingProtection of the victims of human trafficking Each of the 3P areas is evaluated on a 5-point scale and each index is aggregated to the overall 3P Anti-trafficking Index as the  sum (score 3-15).Prosecution Index Score: 1 (no compliance) - 5 (full compliance)Prevention Index Score: 1 (no compliance) - 5 (full compliance)Protection Index Score: 1 (no compliance) - 5 (full compliance)3P Anti-trafficking Policy Index Score: 3 (no compliance for any of the three areas) - 15 (full compliance for all of the three areas) The 3P Anti-trafficking Policy Index is available for each country and each year and currently includes up to 189 countries for the preiod from 2000 to 2015.
  • A
    • Ноябрь 2020
      Источник: Health Effects Institute
      Загружен: Knoema
      Дата обращения к источнику: 17 декабря, 2020
      Выбрать
    • Май 2024
      Источник: Food and Agriculture Organization
      Загружен: Knoema
      Дата обращения к источнику: 07 мая, 2024
      Выбрать
      AQUASTAT is FAO's global information system on water and agriculture, developed by the Land and Water Division. The main mandate of the program is to collect, analyze and disseminate information on water resources, water uses, and agricultural water management with an emphasis on countries in Africa, Asia, Latin America and the Caribbean. This allows interested users to find comprehensive and regularly updated information at global, regional, and national levels.
    • Август 2015
      Источник: World Resources Institute
      Загружен: Knoema
      Дата обращения к источнику: 25 марта, 2019
      Выбрать
      Recent Stress Ranking can be checked here: https://knoema.com/WRINWS2020/national-water-stress-rankings Suggested citation: Luo, T., R. Young, and P. Reig. 2015. "Aqueduct projected water stress rankings." Technical note. Washington, DC: World Resources Institute, August 215. Available online at http://www.wri.org/publication/aqueduct-projected-water-stress-country-rankings.    Supplemental Materials: Country Scores                         WRI projected future country-level water stress for 2020, 2030, and 2040 under business-as-usual (BAU), optimistic, and pessimistic scenarios. Each tab lists country projected water stress scores for each scenario and year, weighted by overall water withdrawals. Scores weighted by individual sectors (agricultural, domestic, and industrial) are provided as well.   These global projections are best suited to making comparisons among countries for the same year and among scenarios and decades for the same region. More detailed and localized data or scenarios can better estimate potential outcomes for specific regions and expose large sub-national variations that are subsumed under countrywide water-stress values. The country indicators face persistent limitations in attempting to simplify complex information, such as spatial and temporal variations, into a single number. They also do not account for the governance and investment structure of the water sector in different countries.    It is important to note the inherent uncertainty in estimating any future conditions, particularly those associated with climate change, future population and economic trends, and water demand. Additionally, care should be taken when examining the change rates of a country’s projected stress levels between one year and another, because the risk-score thresholds are not linear. For more information on these limitations, see the technical note.   Projections are described in further detail in: Luck, M., M. Landis, and F. Gassert, “Aqueduct Water Stress Projections: Decadal Projections of Water Supply and Demand Using CMIP5 GCMs,” Technical note (Washington, DC: World Resources Institute, April 2015), http://www.wri.org/publication/aqueduct-water-stress-projections.   Water Stress withdrawals / available flow Water stress measures total annual water withdrawals (municipal, industrial, and agricultural) expressed as a percentage of the total annual available blue water. Higher values indicate more competition among users. Score Value [0-1) Low (<10%) [1-2) Low to medium (10-20%) [2-3) Medium to high (20-40%) [3-4) High (40-80%) [4-5] Extremely high (>80%)    
  • B
    • Апрель 2024
      Источник: Bertelsmann Stiftung
      Загружен: Knoema
      Дата обращения к источнику: 15 апреля, 2024
      Выбрать
      The Bertelsmann Stiftung’s Transformation Index (BTI) analyzes and evaluates the quality of democracy, a market economy and political management in 128 developing and transition countries. It measures successes and setbacks on the path toward a democracy based on the rule of law and a market economy flanked by sociopolitical safeguards. Within this framework, the BTI publishes two rankings, the Status Index and the Management Index. Countries are further categorized on the basis of these status index and management rankings/scores. For instance, countries are categorized in to 5 groups – viz; 5 or failed, 4 or very limited, 3 or limited, 2 or advanced, and 1 or highly advanced—based on their status index score of 1 to 10. A country with a high score, 8.5 and above, is categorized as highly advanced. A country with a low score, below 4, is categorized as failed. A country is categorized as ‘very limited’ if it has a status index score between 4 and 5.5. A score between 5.5 and 7 means the country is categorized as ‘limited’ and a country is categorized as ‘advanced’ for a score between 7.1 and 8.5. On the basis of the democratic status ranking, countries are further categorized as 5 or ‘hard - line autocracies,’ 4 or ‘moderate autocracies,’ 3 or ‘highly defective democracies,’ 2 or ‘defective democracies,’ and 1 or ‘democracies in consolidation.’ A country with a democratic status ranking below 4 is categorized as a hard line autocracy. A democratic status score between 4 and 5 means that the country is part of the ‘moderate autocracy’ group. A country is grouped as a ‘highly defective democracy’ for a score between 5 and 6. A country is recognized as a ‘defective democracy’ for a score between 6 and 8, and a score of 8 and above earns a country the status of a ‘democracy in consolidation.’ Countries are also categorized in to 5 groups based on their market economy status ranking. The countries are categorized as ‘rudimentary’ or group 5, ‘poorly functioning’ or group 4, ‘functional flaws’ or group 3, ‘functioning’ or group 2, and ‘developed’ or group 1. A country is recognized as a member of the ‘developed’ group with a market economy status ranking/score of 8 and above. A country is grouped as ‘functioning’ if it has a score between 7 and 8. A market economy status ranking between 5 and 7 means the country is categorized to group 3 or the ‘functional flaws’ group. A score between 3 and 5 means that the country is ‘poorly functioning’ and a score below 3 means the country enjoys a ‘rudimentary’ status. Based on the management index ranking, countries are categorized as 5 or failed, 4 or weak, 3 or moderate, 2 or good, and1 or very good. A country is categorized as ‘very good’ for a score of 7 and above. It is categorized as ‘good’ for a score between 5.6 and 7, and as ‘moderate’ for a score between 4.4 and 5.5. A score between 3 and 4.3 means a country is categorized as ‘weak,’ and a score below 3 means the categorization of a country as ‘failed.’ Countries are ranked between 1 and 10 on the basis of the level of difficulty they face. The level of difficulty is further categorized as 5 or negligible, 4 or minor, 3 or moderate, 2 or substantial, and 1 or massive. A score of 8.5 and above means the categorization of the country’s level of difficulty as ‘massive, and a score below 2.5 means the categorization of the level of difficulty faced by the country as ‘negligible.’ The level of difficulty score of 2.5 to 4.4 means a country faces a ‘minor’ level of difficulty and a score between 4.5 and 6.4 means the level of difficulty faced by a country is ‘moderate.’ A country with a score of 6.5 to 8.4 faces a ‘substantial’ level of difficulty.
  • C
    • Январь 2024
      Источник: Transparency International
      Загружен: Knoema
      Дата обращения к источнику: 02 февраля, 2024
      Выбрать
      Data cited at https://www.transparency.org/en/cpi/2020/index/nzl by Transparency International is licensed under CC-BY-ND 4.0. Global Corruption Barometer is the largest world-wide public opinion survey on corruption. see more at https://www.transparency.org/en/cpi/2020/index/nzl Transparency International(TI) defines corruption as the abuse of entrusted power for private gain. This definition encompasses corrupt practices in both the public and private sectors. The Corruption Perceptions Index (CPI) ranks countries according to the perception of corruption in the public sector. The CPI is an aggregate indicator that combines different sources of information about corruption, making it possible to compare countries. The CPI ranks almost 200 countries by their perceived levels of corruption, as determined by expert assessments and opinion surveys.
    • Апрель 2024
      Источник: Numbeo
      Загружен: Knoema
      Дата обращения к источнику: 24 апреля, 2024
      Выбрать
      Data cited at: Numbeo Methodology: The Index has been calculated twice per year by considering the latest 36 months. A). Beginning of the Year and B). Mid Year Crime Index is an estimation of the overall level of crime in a given city or a country. We consider crime levels lower than 20 as very low, crime levels between 20 and 40 as being low, crime levels between 40 and 60 as being moderate, crime levels between 60 and 80 as being high and finally crime levels higher than 80 as being very high. Safety index is, on the other way, quite the opposite of crime index. If the city has a high safety index, it is considered very safe.
    • Декабрь 2020
      Источник: International Lesbian, Gay, Bisexual, Trans and Intersex Association
      Загружен: Knoema
      Дата обращения к источнику: 07 января, 2021
      Выбрать
      Data cited at: International Lesbian, Gay, Trans and Intersex Association-ILGA World 
  • E
    • Июль 2023
      Источник: Atlas of Economic Complexity, Growth Lab Harvard University
      Загружен: Knoema
      Дата обращения к источнику: 02 августа, 2023
      Выбрать
      Data cited at:  Retrieved from-https://atlas.cid.harvard.edu/rankings/product
    • Апрель 2024
      Источник: Observatory of Economic Complexity
      Загружен: B S Ravishanth
      Дата обращения к источнику: 15 апреля, 2024
      Выбрать
      Data cited at:  Retrieved from-https://oec.world/en/rankings/eci/hs6/hs96
    • Май 2024
      Источник: Yale Center for Environmental Law & Policy
      Загружен: Knoema
      Дата обращения к источнику: 13 мая, 2024
      Выбрать
      Data cited at: Wendling, Z. A., Emerson, J. W., Esty, D. C., Levy, M. A., de Sherbinin, A., et al. (2018). 2018 Environmental Performance Index. New Haven, CT: Yale Center for Environmental Law & Policy. https://epi.yale.edu/   The Environmental Performance Index (EPI) is constructed through the calculation and aggregation of 20 indicators reflecting national-level environmental data. These indicators are combined into nine issue categories, each of which fit under one of two overarching objectives. The two objectives that provide the overarching structure of the EPI are Environmental Health and Ecosystem Vitality. Environmental Health measures the protection of human health from environmental harm. Ecosystem Vitality measures ecosystem protection and resource management. These two objectives are further divided into nine issue categories that span high-priority environmental policy issues, including air quality, forests, fisheries, and climate and energy, among others. The issue categories are extensive but not comprehensive. Underlying the nine issue categories are 20 indicators calculated from country-level data and statistics. After more than 15 years of work on environmental performance measurement and six iterations of the EPI, global data are still lacking on a number of key environmental issues. These include: freshwater quality, toxic chemical exposures, municipal solid waste management, nuclear safety, wetlands loss, agricultural soil quality and degradation, recycling rates, adaptation, vulnerability, and resiliency to climate change, desertification.
  • F
    • Июль 2016
      Источник: Financial Freedom Index
      Загружен: Knoema
      Дата обращения к источнику: 09 апреля, 2021
      Выбрать
      The Financial Freedom Index is based on 15 indicators and sub-indicators. For this tabular overview of the entire index the 6 types of tax rates and 3 international taxation indicators have been combined as one "tax score." The other six main indicators are shown as they appear on the "By Indicator" pages. Due to lack of data for some countries, not all nations have been included in the ranking. A score of 1.00 is most favorable, i.e., a 1.00 "tax score" translates into low taxes, as a 1.00 "cost of living score" translates into low living costs.
    • Май 2024
      Источник: Fund for Peace
      Загружен: Knoema
      Дата обращения к источнику: 05 мая, 2024
      Выбрать
      Data cited at: Fragile States Index - https://fragilestatesindex.org/ The FSI focuses on the indicators of risk and is based on thousands of articles and reports that are processed by our CAST Software from electronically available sources. Measures of fragility, like Demographic Pressures,Refugees and IDPs and etc., have been scaled on 0 to 10 where 10 is highest fragility and 0 no fragility.
    • Апрель 2024
      Источник: Freedom House
      Загружен: Knoema
      Дата обращения к источнику: 03 апреля, 2024
      Выбрать
      Freedom Status obtained by Combined Average of the Political Rights and Civil Liberties Ratings (Freedom Rating) Range 1-7; 1-2.5 Free; 3-5: Partly Free and 5.5-7: Not Free The score for the A. Electoral Process subcategory The score for the B. Political Pluralism and Participation subcategory The score for the C. Functioning of Government subcategory The score for the Political Rights category The score for the D. Freedom of Expression and Belief subcategory The score for the E. Associational and Organizational Rights subcategory The score for the F. Rule of Law subcategory The score for the G. Personal Autonomy and Individual Rights subcategory The score for the Civil Liberties category Total aggregate Score for all categories  
  • G
    • Ноябрь 2023
      Источник: TRACE International
      Загружен: Knoema
      Дата обращения к источнику: 17 ноября, 2023
      Выбрать
      'The TRACE Matrix measures business bribery risk in all countries. Developed in collaboration with RAND Corporation, the TRACE Matrix provides the business community with a powerful new tool for anti-bribery risk assessment. It assesses countries across four domains - Business Interactions with Government, Anti-bribery Laws and Enforcement, Government and Civil Service Transparency, and the Capacity for Civil Society Oversight, including the role of the media - as well as nine sub-domains. Business interactions with government includes the sub-domains of “contact with government,” “expectation of paying bribes” and “regulatory burden.” These indicators capture aspects of the “keys with government” that TRACE identified as very important for business bribery through regulatory and business interviews they conducted. Anti-corruption laws enacted by a country and information about enforcement of those laws. Government and civil service transparency, which includes indicators concerning whether government budgets are publicly available and whether there are regulations addressing conflicts of interest for civil servants. Information concerning the extent of press freedom and social development, both of which serve as indicators of a robust civil society that can provide government oversight. The overall country risk score is a combined and weighted score of four domains . For each of these four "domains" (and related sub-domains), the TRACE Matrix aggregates relevant data obtained from leading public interest and international organizations, including the United Nations, the World Bank and the World Economic Forum. Based on statistical analysis of this information, each country is assigned not only an overall score between 1 and 100 — with 100 representing the greatest risk — but also scores for each of the four domains and nine sub-domains. '  TRANSLATE with xEnglishArabicHebrewPolishBulgarianHindiPortugueseCatalanHmong DawRomanianChinese SimplifiedHungarianRussianChinese TraditionalIndonesianSlovakCzechItalianSlovenianDanishJapaneseSpanishDutchKlingonSwedishEnglishKoreanThaiEstonianLatvianTurkishFinnishLithuanianUkrainianFrenchMalayUrduGermanMalteseVietnameseGreekNorwegianWelshHaitian CreolePersian  TRANSLATE with COPY THE URL BELOW BackEMBED THE SNIPPET BELOW IN YOUR SITEEnable collaborative features and customize widget: Bing Webmaster PortalBack
    • Февраль 2024
      Источник: Global Democracy Ranking
      Загружен: Knoema
      Дата обращения к источнику: 26 марта, 2024
      Выбрать
      The average global index score stagnated in 2022. Despite expectations of a rebound after the lifting of pandemic-related restrictions, the score was almost unchanged, at 5.29 (on a 0-10 scale), compared with 5.28 in 2021. The positive effect of the restoration of individual freedoms was cancelled out by negative developments globally. The scores of more than half of the countries measured by the index either stagnated or declined. Western Europe was a positive outlier, being the only region whose score returned to pre-pandemic levels. 
    • Апрель 2024
      Источник: United Nations Statistics Division
      Загружен: Knoema
      Дата обращения к источнику: 08 мая, 2024
      Выбрать
    • Сентябрь 2023
      Источник: Emission Database for Global Atmospheric Research
      Загружен: Knoema
      Дата обращения к источнику: 09 октября, 2023
      Выбрать
      Direct greenhouse gases: Carbon Dioxide (CO2), Methane (CH4), Nitrous Oxide (N2O), Hydrofluorocarbons (HFC-23, 32, 125, 134a, 143a, 152a, 227ea, 236fa, 245fa, 365mfc, 43-10-mee), Perfluorocarbons (PFCs: CF4, C2F6, C3F8, c-C4F8, C4F10, C5F12, C6F14, C7F16), Sulfur Hexafluoride (SF6), Nitrogen Trifluoride (NF3) and Sulfuryl Fluoride (SO2F2). Emissions are calculated by individual countries using country-specific information. The countries are organized in different world regions for illustration purposes. Emissions of some small countries are presented together with other countries depending on country definition and availability of activity statistics. Source: European Commission, Joint Research Centre (JRC)/PBL Netherlands Environmental Assessment Agency.
    • Октябрь 2023
      Источник: Global Hunger Index
      Загружен: Knoema
      Дата обращения к источнику: 20 октября, 2023
      Выбрать
      Global Hunger Index, 2023 The 2023 Global Hunger Index shows that since 2015 little progress has been made in reducing hunger. The 2023 GHI score for the world is 18.3, considered moderate. This is less than one point below the world’s 2015 GHI score of 19.1, indicating that progress on reducing hunger has largely stalled. In contrast, between 2000, 2008, and 2015, the world made significant headway against hunger. There has been an increase in the prevalence of undernourishment, one of the indicators used in the calculation of GHI scores, rising from a low of 7.5 percent in 2017 to 9.2 percent in 2022.
    • Сентябрь 2023
      Источник: Global Innovation Index
      Загружен: Knoema
      Дата обращения к источнику: 18 октября, 2023
      Выбрать
      The Global Innovation Index 2023 captures the innovation ecosystem performance of 132 economies and tracks the most recent global innovation trends.  The GII 2023 tracks global innovation trends against a background of uncertainty caused by slow economic recovery from the COVID-19 pandemic, high-interest rates, and geopolitical conflict, but with the promise of the Digital Age and Deep Science innovation waves and technological progress.  
    • Июнь 2018
      Источник: Open Knowledge International
      Загружен: Knoema
      Дата обращения к источнику: 13 июня, 2018
      Выбрать
    • Апрель 2024
      Источник: Global Initiative against Transnational Organized Crime
      Загружен: Knoema
      Дата обращения к источнику: 01 апреля, 2024
      Выбрать
    • Март 2023
      Источник: Institute for Economics and Peace
      Загружен: Knoema
      Дата обращения к источнику: 29 июня, 2023
      Выбрать
      Data cited at: Institute for Economics and Peace retrieved from Vision of Humanity  The Global Peace Index 2022
    • Ноябрь 2023
      Источник: SolAbility
      Загружен: Knoema
      Дата обращения к источнику: 16 ноября, 2023
      Выбрать
      Highlights of the  Global Sustainable Competiveness Report 2023:Scandinavia continues to top the Sustainable Competitiveness Index: of the top 6 spots, 5 are Scandinavian. Sweden keeps topping the Index.Only one country in the Top 20 is not European: Japan on 12 (South Korea 21).For the first time, China (ranked 30) overtakes the US on rank 32.Germany ranks 15, The UK 16, and France 18.Brazil ranks 65, India 121, and Nigeria – Africa’s most populous nation – 156.Some of the least developed nations have a considerable higher GSCI ranking than their GDP would suggest (e.g. Colombia, Peu, Nepal, Bhutan, Bolivia.
    • Февраль 2024
      Источник: Institute for Economics and Peace
      Загружен: Knoema
      Дата обращения к источнику: 28 марта, 2024
      Выбрать
      Data cited at:  Institute for Economics & Peace and available from http://visionofhumanity.org/reports Note: The Year of data has been considered as year of publication, for example 2020 report is considered as year 2020.   The Global Terrorism Index (GTI) is a comprehensive study which accounts for the direct and indirect impact of terrorism in 163 countries in terms of its effect on lives lost, injuries, property damage and the psychological aftereffects of terrorism. This study covers 99.6 per cent of the world's population. It aggregates the most authoritative data source on terrorism today, the Global Terrorism Database (GTD) collated by the National Consortium for the Study of Terrorism and Responses to Terrorism (START) into a composite score in order to provide an ordinal ranking of nations on the negative impact of terrorism. The GTD is unique in that it consists of systematically and comprehensively coded data on domestic as well as international terrorist incidents and now includes more than 140,000 cases.  
  • H
    • Март 2024
      Источник: United Nations Development Programme
      Загружен: Knoema
      Дата обращения к источнику: 10 апреля, 2024
      Выбрать
      Data Cited at: UNITED NATIONS DEVELOPMENT PROGRAMME, Human Development Data Center The Human Development Index (HDI) is a summary measure of achievements in three key dimensions of human development: a long and healthy life, access to knowledge and a decent standard of living. The HDI is the geometric mean of normalized indices for each of the the three dimensions.
    • Март 2023
      Источник: Our World in Data
      Загружен: Knoema
      Дата обращения к источнику: 24 марта, 2023
      Выбрать
  • I
    • Май 2024
      Источник: Heritage Foundation
      Загружен: Knoema
      Дата обращения к источнику: 05 мая, 2024
      Выбрать
      Data cited at: Heritage Foundation   Economic freedom is the fundamental right of every human to control his or her own labor and property. In an economically free society, individuals are free to work, produce, consume, and invest in any way they please, with that freedom both protected by the state and unconstrained by the state. In economically free societies, governments allow labor, capital and goods to move freely, and refrain from coercion or constraint of liberty beyond the extent necessary to protect and maintain liberty itself. Economic Freedom Scores: Range and level of freedom 80–100:- Free 70–79.9:- Mostly Free 60–69.9:- Moderately Free 50–59.9:- Mostly Unfree 0–49.9:- Repressed
    • Март 2024
      Источник: European Commission
      Загружен: Knoema
      Дата обращения к источнику: 15 марта, 2024
      Выбрать
      The Index for Risk Management INFORM is a composite indicator developed by JRC as a tool for understanding the risk of humanitarian crisis and disasters.
  • N
    • Апрель 2022
      Источник: Global Footprint Network
      Загружен: Knoema
      Дата обращения к источнику: 19 апреля, 2022
      Выбрать
      Citation: Global Footprint Network, National Footprint and Biocapacity Accounts, 2022  Edition Downloaded 2022 -04 -19 from  https://data.footprintnetwork.org .   NFA 2022 National Footprint and Biocapacity Accounts data set (1961-2018) This data includes total and per capita national biocapacity, the ecological footprint of consumption, the ecological footprint of production, and total area in hectares. This dataset, however, does not include any of our yield factors (national or world) nor any equivalence factors.    
    • Август 2019
      Источник: World Resources Institute
      Загружен: Knoema
      Дата обращения к источнику: 07 февраля, 2020
      Выбрать
  • O
    • Май 2024
      Источник: Organisation for Economic Co-operation and Development
      Загружен: Knoema
      Дата обращения к источнику: 14 мая, 2024
      Выбрать
  • P
    • Май 2024
      Источник: Political Terror Scale
      Загружен: Knoema
      Дата обращения к источнику: 01 мая, 2024
      Выбрать
        Political Terror Scale Levels 1 - Coun­tries un­der a se­cure rule of law, people are not im­prisoned for their views, and tor­ture is rare or ex­cep­tion­al. Polit­ic­al murders are ex­tremely rare. 2 - There is a lim­ited amount of im­pris­on­ment for non­vi­ol­ent polit­ic­al activ­ity. However, few per­sons are af­fected, tor­ture and beat­ings are ex­cep­tion­al. Polit­ic­al murder is rare. 3 - There is ex­tens­ive polit­ic­al im­pris­on­ment, or a re­cent his­tory of such im­pris­on­ment. Ex­e­cu­tion or oth­er polit­ic­al murders and bru­tal­ity may be com­mon. Un­lim­ited de­ten­tion, with or without a tri­al, for polit­ic­al views is ac­cep­ted. 4 - Civil and polit­ic­al rights vi­ol­a­tions have ex­pan­ded to large num­bers of the pop­u­la­tion. Murders, dis­ap­pear­ances, and tor­ture are a com­mon part of life. In spite of its gen­er­al­ity, on this level ter­ror af­fects those who in­terest them­selves in polit­ics or ideas. 5 - Ter­ror has ex­pan­ded to the whole pop­u­la­tion. The lead­ers of these so­ci­et­ies place no lim­its on the means or thor­ough­ness with which they pur­sue per­son­al or ideo­lo­gic­al goals.   Note- NA_Status_A, NA_Status_H, and NA_Status_S corresponds to  PTS_A, PTS_H, and PTS_S respectively0= The value ‘0’ is assigned where the respective human rights report was available and has been coded66= The value ‘66’ is reserved for missing PTS scores due to missing reports 77=The value ‘77’ is assigned where reports no-longer exist, or do not exist yet88=The value ‘88’ is assigned for units that exist  but no report was published and thus no PTS score is assigned99= The value ‘99’ is assigned where human rights report was published but no PTS score was assigned  
    • Февраль 2021
      Источник: United Nations Conference on Trade and Development
      Загружен: Knoema
      Дата обращения к источнику: 18 февраля, 2021
      Выбрать
      PCI is calculated as a geometric average of eight domains or categories, namely, ICTs, structural change, natural capital, human capital, energy, transport, the private sector and institutions
  • Q
    • Январь 2024
      Источник: Quality of Government Institute
      Загружен: Knoema
      Дата обращения к источнику: 07 февраля, 2024
      Выбрать
      The main objective of the research is to address the theoretical and empirical problems of how political institutions of high quality can be created and maintained. The second objective is to study the effects of Quality of Government on a number of policy areas, such as health, environment, social policy, and poverty. Data citation: Teorell, Jan, Aksel Sundström, Sören Holmberg, Bo Rothstein, Natalia Alvarado Pachon, Cem Mert Dalli, Rafael Lopez Valverde & Paula Nilsson. 2024. The Quality of Government Standard Dataset, version Jan24. University of Gothenburg: The Quality of Government Institute, https://www.gu.se/en/quality-government doi:10.18157/qogstdjan24
  • S
    • Апрель 2024
      Источник: Scimago Institutions Rankings
      Загружен: Knoema
      Дата обращения к источнику: 15 апреля, 2024
      Выбрать
      The SCImago Institutions Rankings (SIR) is a classification of academic and research-related institutions ranked by a composite indicator that combines three different sets of indicators based on research performance, innovation outputs and societal impact measured by their web visibility. It provides a friendly interface that allows the visualization of any customized ranking from the combination of these three sets of indicators. Additionally, it is possible to compare the trends for individual indicators of up to six institutions. For each large sector it is also possible to obtain distribution charts of the different indicators.  
  • T
    • Декабрь 2021
      Источник: Global Health Security Index
      Загружен: Knoema
      Дата обращения к источнику: 15 декабря, 2021
      Выбрать
      Data cited at Global Health Security Index; October 2019 - https://www.ghsindex.org/wp-content/uploads/2020/04/2019-Global-Health-Security-Index.pdf
    • Май 2023
      Источник: Walk Free Foundation
      Загружен: Knoema
      Дата обращения к источнику: 29 мая, 2023
      Выбрать
      The Global Slavery Index, the flagship report of the Walk Free Foundation. The Global Slavery Index estimates the number of people in modern slavery in 167 countries. It is a tool for citizens, non government organisations, businesses and public officials to understand the size of the problem, existing responses and contributing factors, so they can build sound policies that will end modern slavery. The Global Slavery Index answers the following questions: What is the estimated prevalence of modern slavery country by country, and what is the absolute number by population? How are governments tackling modern slavery? What factors explain or predict the prevalence of modern slavery? Government Response Rating by Country A - 70 to 79.9 BBB - 60 to 69.9 BB - 50 to 59.9 B - 40 to 49.9 CCC - 30 to 39.9 DC - 20 to 29.9 C - 10 to 19.9 D - <0 to 9.9
  • U
    • Сентябрь 2022
      Источник: United Nations Public Administration Country Studies
      Загружен: Knoema
      Дата обращения к источнику: 06 октября, 2022
      Выбрать
      Data cited at: UN E-Government Knowledgebase - https://publicadministration.un.org/egovkb/en-us/ 1. The EGDI is based on a comprehensive Survey of the online presence of all 193 United Nations Member States, which assesses national websites and how e-government policies and strategies are applied in general and in specific sectors for delivery of essential services. The assessment rates the e-government performance of countries relative to one another as opposed to being an absolute measurement. The results are tabulated and combined with a set of indicators embodying a country’s capacity to participate in the information society, without which e-government development efforts are of limited immediate use. Although the basic model has remained consistent, the precise meaning of these values varies from one edition of the Survey to the next as understanding of the potential of e-government changes and the underlying technology evolves. This is an important distinction because it also implies that it is a comparative framework that seeks to encompass various approaches that may evolve over time instead of advocating a linear path with an absolute goal. 2. E-Government Development Index-EGDI Very High-EGDI (Greater than 0.75) High-EGDI (Between 0.50 and 0.75) Middle-EGDI (Between 0.25 and 0.50) Low-EGDI (Less than 0.25)
    • Июль 2022
      Источник: Notre Dame Global Adaptation Initiative
      Загружен: Knoema
      Дата обращения к источнику: 19 августа, 2022
      Выбрать
      The ND-GAIN Country Index summarizes a country's vulnerability to climate change and other global challenges in combination with its readiness to improve resilience. It aims to help governments, businesses and communities better prioritize investments for a more efficient response to the immediate global challenges ahead.  View the ND-GAIN technical documentation for more information
  • W
    • Октябрь 2023
      Источник: Georgetown Institute for Women, Peace and Security
      Загружен: Knoema
      Дата обращения к источнику: 15 ноября, 2023
      Выбрать
        The WPS Index is a simple and transparent measure that captures women’s autonomy and empowerment at home, in the community, and in society. The index is structured around three basic dimensions of women’s well-being: inclusion (economic, social, political); justice (formal laws and informal discrimination); and security (at the individual, community, and societal levels. This second edition adds more than a dozen countries—including Libya and South Sudan—that meet the minimum requirements of recent and reliable data across the three dimensions. Those additions bring the total ranking to 167 countries, encompassing more than 98 percent of the world’s population.
    • Май 2024
      Источник: World Bank
      Загружен: Knoema
      Дата обращения к источнику: 03 мая, 2024
      Выбрать
      The primary World Bank collection of development indicators, compiled from officially-recognized international sources. It presents the most current and accurate global development data available, and includes national, regional and global estimates
    • Март 2024
      Источник: Reporters Without Borders
      Загружен: Knoema
      Дата обращения к источнику: 18 марта, 2024
      Выбрать
      The Range of Score to Access the Press Freedom. (New Scale) From 85 to 100 points: Good From 70 to 85 points: Satisfactory From 55 to 70 points: Problematic From 40 to 55 points: Difficult From 0 to 40 points: Very Serious   The Range of Score to Access the Press Freedom. (Old Scale) From 0 to 15 points: Good From 15.01 to 25 points: Fairly good From 25.01 to 35 points: Problematic From 35.01 to 55 points: Bad From 55.01 to 100 points: Very bad Note: Negative value is available for 2012 only and it represents the country in top* The press freedom index that Reporters Without Borders publishes every year measures the level of freedom of information in nearly 180 countries. It reflects the degree of freedom that journalists, news organizations and netizens enjoy in each country, and the efforts made by the authorities to respect and ensure respect for this freedom. It is based partly on a questionnaire that is sent to our partner organizations (18 freedom of expression NGOs located in all five continents), to our network of 150 correspondents, and to journalists, researchers, jurists and human rights activists. The 179 countries ranked in this year's index are those for which Reporters Without Borders received completed questionnaires from various sources. Some countries were not included because of a lack of reliable, confirmed data. A score and a position are assigned to each country in the final ranking. They are complementary indicators that together assess the state of press freedom. In order to make the index more informative and make it easier to compare different years, scores will henceforth range from 0 to 100, with 0 being the best possible score and 100 the worst. The index reflects the situation during a specific period. This year's index is based solely on events between the start of December 2012 and the end of November 2013. It does not look at human rights violations in general, just violations of freedom of information. The index should in no way be taken as an indication of the quality of the media in the countries concerned. In order to make the index more informative and make it easier to compare different years, scores will henceforth range from 0 to 100, with 0 being the best possible score and 100 the worst. The index reflects the situation during a specific period. This year's index is based solely on events between the start of December 2012 and the end of November 2013. It does not look at human rights violations in general, just violations of freedom of information. The index should in no way be taken as an indication of the quality of the media in the countries concerned. In order to make the index more informative and make it easier to compare different years, scores will henceforth range from 0 to 100, with 0 being the best possible score and 100 the worst. The index reflects the situation during a specific period. This year's index is based solely on events between the start of December 2012 and the end of November 2013. It does not look at human rights violations in general, just violations of freedom of information. The index should in no way be taken as an indication of the quality of the media in the countries concerned. This year's index is based solely on events between the start of December 2012 and the end of November 2013. It does not look at human rights violations in general, just violations of freedom of information. The index should in no way be taken as an indication of the quality of the media in the countries concerned. This year's index is based solely on events between the start of December 2012 and the end of November 2013. It does not look at human rights violations in general, just violations of freedom of information. The index should in no way be taken as an indication of the quality of the media in the countries concerned.   * In order to have a bigger spread in the scores and increase the differentiation between countries, this year's questionnaire had more answers assigning negative points. That is why countries at the top of the index have negative scores this year. Although the point system has produced a broader distribution of scores than in 2010, each country's evolution over the years can still be plotted by comparing its position in the index rather than its score. This is what the arrows in the table refer to – a country's change in position in the index compared with the preceding year.      
    • Апрель 2024
      Источник: World Bank
      Загружен: Knoema
      Дата обращения к источнику: 30 апреля, 2024
      Выбрать
      The Worldwide Governance Indicators (WGI) project reports aggregate and individual governance indicators for over 200 countries and territories over the period 1996–2020, for six dimensions of governance:Voice and AccountabilityPolitical Stability and Absence of ViolenceGovernment EffectivenessRegulatory QualityRule of LawControl of Corruption The Worldwide Governance Indicators (WGI) are a research dataset summarizing the views on the quality of governance provided by a large number of enterprise, citizen and expert survey respondents in industrial and developing countries. These data are gathered from a number of survey institutes, think tanks, non-governmental organizations, international organizations, and private sector firms. The WGI do not reflect the official views of the World Bank, its Executive Directors, or the countries they represent. The WGI are not used by the World Bank Group to allocate resources. Measure description: Estimate:-Estimate of governance (ranges from approximately -2.5 (weak) to 2.5 (strong) governance performance) Standard error (StdErr):-Standard error reflects variability around the point estimate of governance. Number of sources (NumSrc):-Number of data sources on which estimate is based Rank:-Percentile rank among all countries (ranges from 0 (lowest) to 100 (highest) rank) Lower:-Lower bound of 90% confidence interval for governance, in percentile rank terms Upper:-Upper bound of 90% confidence interval for governance, in percentile rank terms