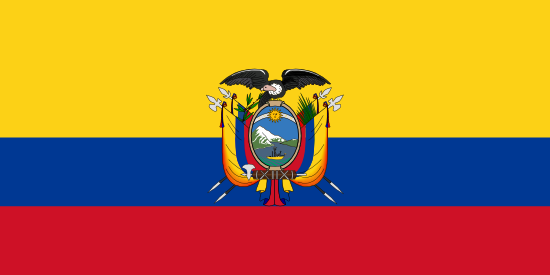
Эквадор

  • Президент:Guillermo Lasso
  • Вице-президент:Alfredo Borrero
  • Столица:Quito
  • Языки:Spanish (Castilian) 93% (official), Quechua 4.1%, other indigenous 0.7%, foreign 2.2% note: (Quechua and Shuar are official languages of intercultural relations; other indigenous languages are in official use by indigenous peoples in the areas they inhabit) (2010 est.)
  • Правительство
  • Статистическое агентство
  • Население, человек:18 284 414 (2024)
  • Площадь, кв км:248 360
  • ВВП на душу населения, долл. США:6 391 (2022)
  • ВВП, млрд. долл. США:115,0 (2022)
  • Индекс Джини:45,5 (2022)
  • Рейтинг Ease of Doing Business:129
Все наборы данных: D E F G I T
  • D
    • Февраль 2021
      Источник: Eurostat
      Загружен: Knoema
      Дата обращения к источнику: 09 февраля, 2021
      Выбрать
      The indicator shows the total daily calorie supply per capita and the split into calories from animal products and vegetal products. It should not be confused with the per capita consumption of those products (calorie consumption) as calorie supply includes also losses through food distribution and mismanagement. The supply data are based on the food balance sheets (FBS) available at FAOSTAT. Data sources are primarily FAO questionnaires, national publications available in the ESS Library and Country visits by statisticians involving discussions with national experts. The food balance sheet shows the availability for human consumption for each food item i.e. each primary commodity, which corresponds to the sources of supply and its utilisation. The total quantity of all foodstuffs produced in a country added to the total quantity imported and adjusted to any change in stocks that may have occurred since the beginning of the reference period, gives the supply available during that period. Data on per capita food supplies are expressed in terms of quantity and by applying appropriate food composition factors for all primary and processed products. The data for this indicator can also be expressed in terms of its energy value. More information can be found in the FAO Handbook on Food Balance Sheets
  • E
    • Сентябрь 2023
      Источник: U.S. Department of Agriculture
      Загружен: Misha Gusev
      Дата обращения к источнику: 29 сентября, 2023
      Выбрать
      Note: Data is no longer being updated on source: https://www.ers.usda.gov/topics/international-markets-us-trade/international-consumer-and-food-industry-trends/#data The Dataset contain data on expenditures on food (including nonalcoholic beverages), alcoholic beverages, and tobacco as a share of consumer expenditures on all goods and services for 86 countries. The tables also contain data on per capita consumer expenditures on goods and services, as well as per capita food expenditures for these countries. Data is available for the 104 countries for which this type of information is currently available in the source database, Euromonitor International. All expenditure data are in current U.S. dollars.
  • F
    • Апрель 2024
      Источник: Food and Agriculture Organization
      Загружен: Dinesh Kumar Gouducheruvu
      Дата обращения к источнику: 15 апреля, 2024
      Выбрать
      Note: Ex: <0.1,<0.2,<0.3 considered as 0.1,0.2,0.3 values  
    • Сентябрь 2017
      Источник: Knoema
      Загружен: Knoema
      Дата обращения к источнику: 11 сентября, 2017
      Выбрать
       
    • Июль 2021
      Источник: U.S. Department of Agriculture
      Загружен: Dinesh Kumar Gouducheruvu
      Дата обращения к источнику: 06 августа, 2021
      Выбрать
      Food Security Measures for IFSA Countries, 2021 and 2031
  • G
    • Октябрь 2021
      Источник: Oxfam
      Загружен: Knoema
      Дата обращения к источнику: 26 октября, 2021
      Выбрать
      Around the world, one in eight people go to bed hungry every night, even though there is enough food for everyone. Our graph illustrates how over consumption, misuse of resources and waste are common elements of a system that leaves hundreds of millions without enough to eat.
    • Октябрь 2023
      Источник: Global Hunger Index
      Загружен: Knoema
      Дата обращения к источнику: 20 октября, 2023
      Выбрать
      Global Hunger Index, 2023 The 2023 Global Hunger Index shows that since 2015 little progress has been made in reducing hunger. The 2023 GHI score for the world is 18.3, considered moderate. This is less than one point below the world’s 2015 GHI score of 19.1, indicating that progress on reducing hunger has largely stalled. In contrast, between 2000, 2008, and 2015, the world made significant headway against hunger. There has been an increase in the prevalence of undernourishment, one of the indicators used in the calculation of GHI scores, rising from a low of 7.5 percent in 2017 to 9.2 percent in 2022.
  • I
    • Декабрь 2020
      Источник: Knoema
      Загружен: Misha Gusev
      Выбрать
      Index of Grain Price Vulnerability is estimated as a share of expenditures on imported grains in total final household consumption normalized by relative level of GDP per capita. Sources: FAO, USDA, World Bank
  • T